Every option that trades has to be hedged by someone. When a market maker sells you a call, they don't want to bet on the stock — they want to earn the spread and stay neutral. So they buy shares to offset the risk. That single mechanic, repeated across millions of contracts every day, is the entire reason Gamma Exposure (GEX) exists as a signal: it's an estimate of how much buying or selling dealers will be mechanically forced into as the underlying price moves.
GEX doesn't predict direction. It predicts behavior — whether the market is likely to absorb a move quietly or amplify it. That distinction is why professional desks watch it every session, and why retail traders who only look at price action are missing half the picture.
Here is what the mechanism actually supports, and where it stops:
- What GEX explains well: why some rallies stall at round, heavily-traded strikes; why low-volatility grinds can suddenly turn into fast, one-directional moves; why certain price levels act like magnets into options expiration.
- What GEX does not explain: which direction the market goes next, what news will move it, or when a regime will change. It describes the terrain, not the weather.
- Key limits: every public GEX estimate rests on modeling assumptions about who's on which side of a trade — dealer positioning is inferred, never directly observed, since market makers don't publish their books.
Key Takeaways
| Point | Details |
|---|---|
| GEX measures behavior, not direction | It estimates how much dealers must buy or sell to stay hedged as price moves — a volatility and liquidity signal, not a forecast of where price goes. |
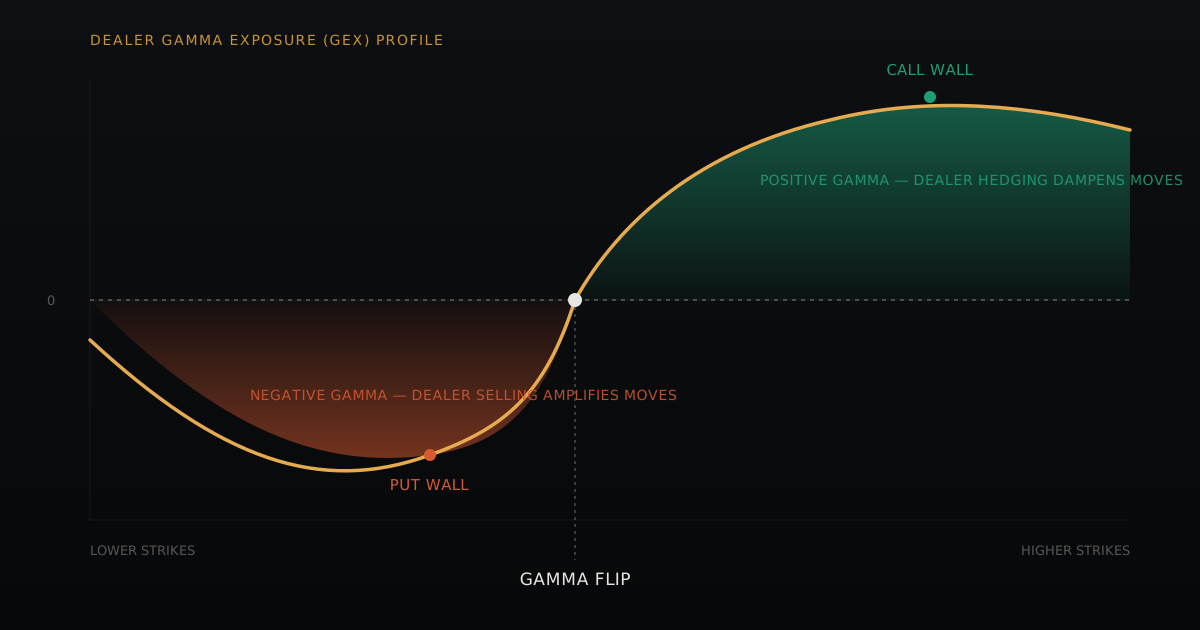
| The sign is what matters most | Positive GEX means dealers are net long gamma and tend to dampen moves; negative GEX means they're net short gamma and tend to amplify them. |
| The Gamma Flip is the regime line | The estimated spot level where aggregate dealer gamma crosses zero — above it, expect compression; below it, expect expansion. |
| Walls mark where hedging concentrates | Strikes with unusually large open interest create "walls" that can act as magnets (positive gamma) or accelerants (negative gamma) as price approaches them. |
| OTM Pulse operationalizes the read | OTM Pulse computes GEX, DEX, and the Gamma Flip in real time across CME futures, FX, and crypto — turning the raw options chain into a structured regime read instead of a manual spreadsheet exercise. |
On this page
- What Is Gamma Exposure (GEX)?
- Why Dealers Hedge — And Why It Moves the Market
- The Gamma Flip: Where the Regime Changes
- Reading a GEX Profile: Walls, Max Pain, Demand & Supply
- GEX vs. DEX: Two Layers of the Same Picture
- Common Mistakes Traders Make With GEX
- Building a GEX-Aware Trading Workflow
- Limitations: What GEX Doesn't Tell You
- How OTM Pulse Fits Into This Workflow
What Is Gamma Exposure (GEX)?
Gamma is the option Greek that measures how fast an option's delta changes as the underlying price moves. A high-gamma option has a delta that swings quickly; a low-gamma option barely reacts. Gamma Exposure aggregates this across every strike and expiration in an options chain, weighted by open interest, to estimate the total gamma sitting on dealers' books — not yours, not the fund down the street, but the market makers who took the other side of the trade.
The concept was popularized publicly by a SqueezeMetrics white paper in 2016, later revised in 2017, and has since become a standard layer across professional options-analytics platforms. The core assumption behind the naive dealer model: when a customer buys a call, the dealer who sold it is short that call — and short gamma. When a customer sells a put, the dealer buys it and again ends up net short gamma on that leg. Aggregate every strike this way and you get a single number, positive or negative, that estimates the market's structural posture.
Why this matters practically: gamma tells you how reactive dealer hedging will be. A market with high aggregate gamma near the current price means small moves force large hedging flows. A market with low gamma near price means dealers barely need to touch their hedges — the tape can drift with less structural resistance in either direction.
Why Dealers Hedge — And Why It Moves the Market
Delta hedging is the standard mechanism: a market maker who sells an option immediately trades the underlying to neutralize directional exposure, then continuously rebalances that hedge as the option's delta changes with price, time, and volatility. This isn't optional risk management on the side — it's the core discipline that lets a dealer quote two-sided markets all day without betting the firm on direction.
The rebalancing is what creates market impact, and the sign of the dealer's gamma determines which direction that impact pushes:
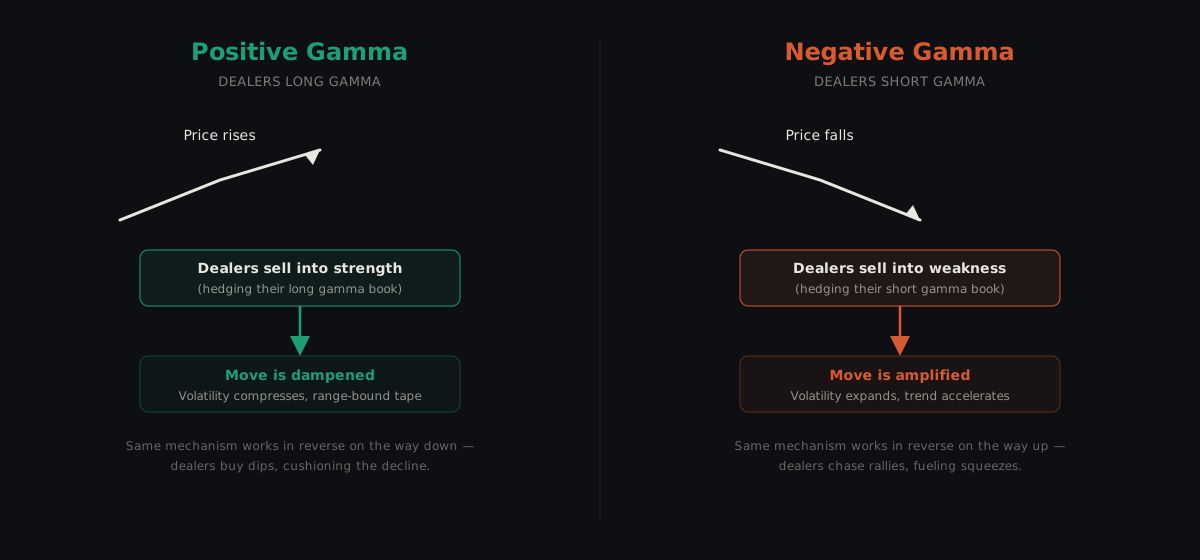
- Positive gamma (dealers net long): as price rises, the dealer's hedge becomes progressively short-biased, so they sell into the rally to stay neutral. As price falls, they buy into the decline. The net effect is a stabilizing, mean-reverting push — often described as dealers "selling rips and buying dips."
- Negative gamma (dealers net short): the mechanism reverses. As price rises, the dealer must buy more to stay hedged, adding fuel to the rally. As price falls, they sell more, adding fuel to the decline. Hedging flow chases price instead of leaning against it — an amplifying, trend-extending push.
Cboe's own research on 0DTE options describes this directly: when options market makers hold negative gamma and delta-hedge it, the resulting rebalancing trades can measurably increase the variance of the underlying index at short time horizons. This isn't a fringe theory — it's documented market-structure research from the exchange that lists the contracts.
The Gamma Flip: Where the Regime Changes
The Gamma Flip (also called the zero-gamma level) is the estimated spot price where aggregate dealer gamma crosses from negative to positive. It's arguably the single most important number on a GEX profile, because it tells you which of the two regimes above you're currently operating in — and regime, more than any indicator, determines how a given day is likely to feel.
- Price above the Gamma Flip: dealers are net long gamma. Expect compression — narrower ranges, mean-reverting price action, and a tendency for the tape to pin near heavily-traded strikes as expiration approaches.
- Price below the Gamma Flip: dealers are net short gamma. Expect expansion — wider ranges, trend persistence, and a higher chance that a move that starts small doesn't stay small.
Pro tip: the Gamma Flip isn't a wall or a support/resistance line in the technical-analysis sense — it's a regime boundary. Price crossing it doesn't mean "reverse," it means "the character of the tape is about to change." Traders who treat it as a hard level to fade get whipsawed; traders who treat it as a volatility-regime switch adjust position sizing and stop placement instead.
Reading a GEX Profile: Walls, Max Pain, Demand & Supply
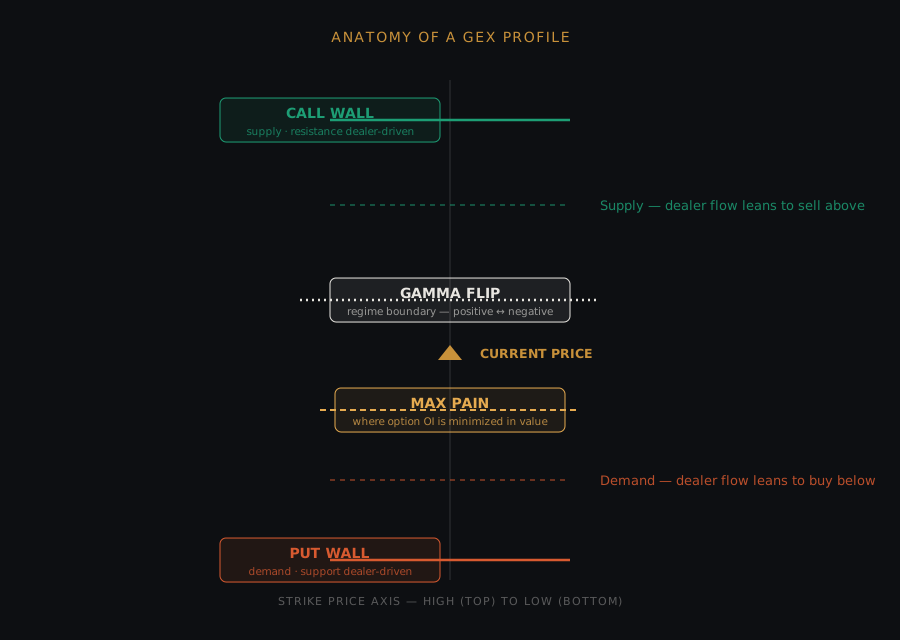
A full GEX profile plots exposure by strike, not just as a single aggregate number. That per-strike detail is where the operationally useful levels come from:
| Level | What it represents | Typical behavior |
|---|---|---|
| Call Wall | Strike with the largest positive gamma concentration, usually driven by heavy call open interest | Acts as resistance / a magnet in positive-gamma regimes; can fail and become a launchpad if breached with force |
| Put Wall | Strike with the largest negative gamma concentration, usually driven by heavy put open interest | Acts as support / a floor in positive-gamma regimes; can accelerate declines if breached in a negative-gamma tape |
| Max Pain | The strike where the total value of outstanding options (calls + puts) is minimized at expiration | A mild pinning tendency into expiry, strongest on low-gamma, low-volume days — not a reliable standalone signal |
| Demand / Supply zones | Price bands where net dealer flow structurally leans to buy (demand, below price) or sell (supply, above price) | Softer than a wall — a lean in the flow, not a hard level |
A wall is a probability lean, not a guarantee. The Avellaneda & Lipkin model of stock pinning — one of the earliest formal treatments of this mechanism — showed that unusually large open interest at a strike can create a genuine price-impact effect from aggregate delta-hedging, but expressed it as a probability of pinning, conditioned on volatility and time to expiration, not a certainty. A wall can hold for days and then get run over in an afternoon if enough directional flow shows up to overwhelm the hedging pressure.
GEX vs. DEX: Two Layers of the Same Picture
GEX and DEX (Delta Exposure) get used together so often that traders sometimes treat them as one signal. They're not — they answer different questions:
| GEX (Gamma Exposure) | DEX (Delta Exposure) | |
|---|---|---|
| Question it answers | How reactive is dealer hedging as price moves? | Which direction is dealer flow currently biased? |
| What it's built from | Gamma × open interest, aggregated by strike | Delta × open interest, aggregated by strike |
| What a strong reading suggests | Amplification or dampening of the next move | A directional lean in current dealer positioning |
| Best used for | Setting expectations for volatility and range | Cross-checking a directional thesis against dealer flow |
Vanna (delta's sensitivity to implied volatility) and charm (delta's decay as time passes) round out the fuller picture professional desks track, but GEX and DEX together already answer the two questions that matter most for a swing or intraday trader: how much will this move if it starts moving, and which way is dealer flow leaning right now.
Common Mistakes Traders Make With GEX
- Treating GEX as a directional signal. It's a volatility and liquidity signal. A deeply negative GEX reading doesn't mean "the market will fall" — it means "if the market moves, expect that move to extend."
- Fading every wall mechanically. Walls are probability leans built from open interest that changes daily. A wall with light supporting open interest, or one already tested multiple times in a session, has less structural force behind it than a fresh, heavily-loaded one.
- Ignoring 0DTE distortion. Same-day, at-the-money options can carry outsized gamma relative to their open interest. On expiration-heavy days, the profile can shift meaningfully within hours — a morning read can be stale by the afternoon.
- Using GEX in isolation. SpotGamma's own public education is explicit on this point: GEX should be combined with price, implied and realized volatility, event risk, and live order flow — not read as a standalone oracle.
- Assuming every provider agrees. Public GEX figures depend on modeling assumptions — which side of a trade dealers are assumed to be on, which options model prices gamma, which expirations get included. Two providers can show meaningfully different Gamma Flip levels for the same underlying on the same day.
Building a GEX-Aware Trading Workflow
- Start with regime, not price. Before looking at any chart pattern, check whether price is above or below the Gamma Flip. This sets your baseline expectation for range and volatility for the session.
- Map the walls. Identify the nearest Call Wall and Put Wall relative to current price — these are your structural boundaries for the day, not your entry triggers.
- Cross-check with DEX. If GEX says "expect compression" but DEX shows dealers heavily short calls near current price, that's a tension worth understanding before sizing a position.
- Adjust position sizing to regime, not just to volatility indicators. Negative-gamma days call for wider stops and smaller size — the same technical setup can produce a very different outcome depending on which side of the flip you're trading.
- Watch for wall failures, not just wall touches. A strike getting tapped and holding confirms the level; a strike getting run through on volume is information too — often more useful than the touch itself.
- Refresh into the close and after major flow. GEX profiles shift as new option volume prints, especially on 0DTE-heavy underlyings. A profile from the opening bell is a starting point, not a fixed map for the whole session.
Limitations: What GEX Doesn't Tell You
GEX describes market structure and volatility sensitivity — not the market's next direction, and every public figure depends on modeling assumptions about dealer positioning that can't be directly verified, since market makers don't publish their books. Open interest, option chains, and put/call ratios describe visible contracts and activity, but the data doesn't identify which specific participant holds which side of any given contract.
Treat GEX as one structured input among several — price, volatility, event calendar, and live order flow all still matter. A wall can fail. A negative-gamma regime can stay quiet for hours until another catalyst initiates the move the setup was warning about. GEX tells you what dealers are likely to do if price gets there; it doesn't guarantee price gets there, or when.
How OTM Pulse Fits Into This Workflow
Everything above is a manual process if you're pulling option chains yourself, computing gamma by strike, and tracking the flip level across multiple underlyings by hand. OTM Pulse computes the full GEX/DEX profile — Gamma Flip, Call Wall, Put Wall, Max Pain, demand/supply zones — in real time across CME futures (Gold, Silver, Crude, S&P, Nasdaq, Russell), major FX pairs, and crypto, refreshed continuously instead of once at the open.
The War Room view lays the full price map on a single screen with the regime already classified, so the question isn't "let me go compute today's flip level" — it's already there, alongside the same insider-signal and COT-positioning layers covered in our guide to insider buying signals, so a directional thesis and its structural context arrive together instead of requiring separate lookups across different tools.
See the regime, not just the price
Run this workflow without building it from scratch — OTM Pulse pairs GEX/DEX regime context with real-time alerts on the levels that matter.
Sources and further reading
- SpotGamma: Gamma Exposure (GEX) — practitioner-level explainer covering how GEX is estimated, calculated, and read, including its limitations.
- Avellaneda & Lipkin (2003), "A market-induced mechanism for stock pinning," Quantitative Finance — the foundational academic model connecting aggregate delta-hedging to price pinning at option strikes.
- Cboe: 0DTE Index Options and Market Volatility — exchange research on how options market maker gamma positioning relates to measured index variance.
- Cboe Insights: Evaluating the Market Impact of SPX 0DTE Options — accessible walkthrough of gamma hedging mechanics and 0DTE market-impact debate.
- LuxAlgo: Gamma Exposure — concise technical reference on GEX construction, sign convention, and the zero-gamma flip.
This article is general information, not a substitute for advice from a qualified financial advisor. Consult a qualified financial professional about your own circumstances before acting on anything here.